Silent Losses: How to Detect and Correct Hidden Solar System Underperformance
There is a common assumption among solar homeowners: once the panels are on the roof and the inverter is humming, the system takes care of itself. The utility bills drop, the monitoring app shows green indicators, and everything appears to be working as intended. What that assumption misses, however, is the distinction between a system that is operating and one that is performing optimally.
Research from the National Renewable Energy Laboratory (NREL) and independent field studies consistently show that real-world solar installations frequently deliver 15 to 25 percent less energy than their rated capacity — sometimes significantly more. The troubling part is that many of these losses are invisible to the untrained eye and go unaddressed for years. For a residential system sized at 10 kilowatts, that gap can translate to hundreds of dollars in unrealized savings annually.
This article examines the primary causes of silent underperformance, explains how to evaluate your system against meaningful benchmarks, and outlines practical corrective measures that do not necessarily require expensive equipment replacements.
Understanding Panel Degradation: The Slow Fade
Solar panels do not fail dramatically. They fade. The photovoltaic cells within each panel experience a gradual reduction in output efficiency over time — a process known as degradation. Most tier-one manufacturers rate their panels at a degradation rate of approximately 0.5 percent per year, with a guarantee that panels will still produce at least 80 percent of their original capacity after 25 years.
In practice, however, degradation rates can be higher depending on the panel technology, local climate conditions, and installation quality. Panels in regions with extreme heat cycling — such as the desert Southwest — or those exposed to persistent humidity and salt air along coastal areas may degrade more rapidly than laboratory models predict.
Light-induced degradation (LID), which occurs in the first hours and days of sun exposure, is a separate phenomenon that can cause an initial output drop of 1 to 3 percent in certain cell types. Potential-induced degradation (PID), caused by voltage stress and moisture infiltration, can be far more severe and is often linked to grounding issues or substandard module manufacturing.
If your system is more than five years old and you have never had a formal performance audit, degradation is a reasonable first suspect when output appears lower than expected.
Shading: The Underestimated Energy Thief
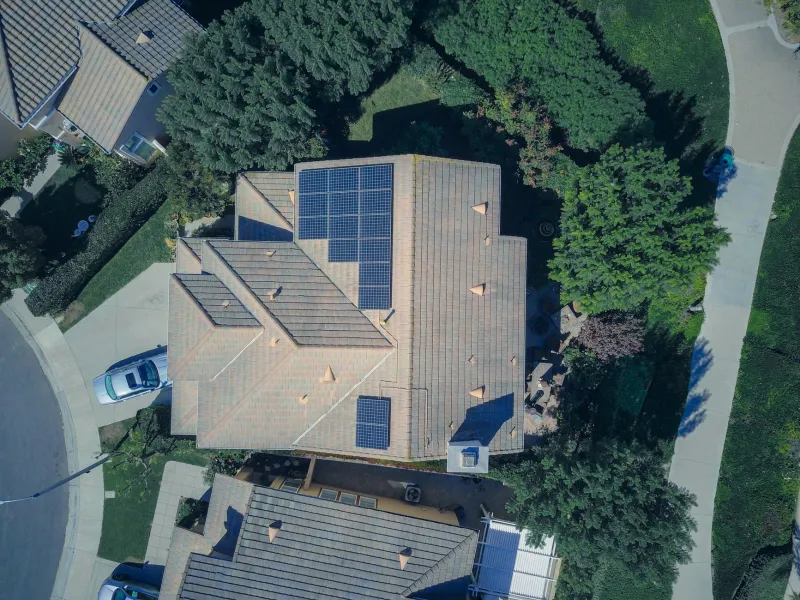
Shading is one of the most consequential — and frequently underestimated — sources of solar underperformance. A single shaded cell within a panel can disproportionately reduce the output of that entire panel, and depending on the inverter architecture, potentially affect neighboring panels as well.
The shading landscape around a home is not static. Trees grow. New structures are built on adjacent properties. Rooftop equipment such as HVAC units or satellite dishes may shift. A tree that posed no shading problem at the time of installation may, five years later, cast a shadow across a critical section of the array during peak production hours.
String inverter systems are particularly vulnerable to partial shading because all panels in a string are constrained by the lowest-performing module. Microinverter and DC power optimizer systems handle shading more gracefully by allowing each panel to operate independently, but they are not immune to significant losses when shading is extensive.
A shading analysis using tools such as a Solar Pathfinder, a drone-based thermal imaging survey, or software modeling can quantify exactly how much production your array is losing due to obstructions — and whether tree trimming, panel repositioning, or a system architecture change would be cost-effective.
Soiling, Debris, and the Maintenance Gap
Dirt, bird droppings, pollen accumulation, and leaf debris may sound like minor inconveniences, but their impact on energy production is measurable and well-documented. Studies have found that soiling alone can reduce panel output by 5 to 7 percent under typical conditions, and substantially more in areas with high dust levels, agricultural activity, or significant bird populations.
Many US homeowners operate under the belief that rainfall is sufficient to keep panels clean. In regions with frequent rain and minimal particulate pollution, this assumption holds reasonably well. In drier climates — across California's Central Valley, the Intermountain West, or the Texas Panhandle — rainfall is infrequent enough that manual cleaning becomes a meaningful maintenance task.
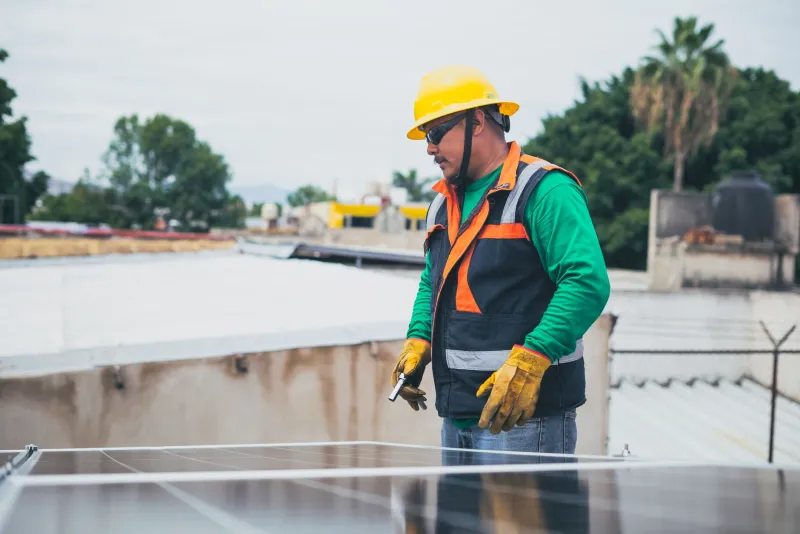
Beyond surface soiling, physical inspections should also check for microcracks in panels, loose or corroded electrical connections, and any signs of water intrusion into junction boxes or conduit. These issues rarely announce themselves through visible failure but can impose consistent production penalties over time.
How to Benchmark Your System's Actual Output
Identifying underperformance requires a reference point. The most useful benchmark is the system's expected production based on your specific location, panel orientation, tilt angle, and installed capacity. Tools such as NREL's PVWatts Calculator allow you to model expected monthly and annual output using historical solar irradiance data for virtually any US zip code.
Once you have a modeled baseline, compare it against your actual production data — available through your inverter's monitoring portal or a third-party energy monitoring device. A consistent shortfall of more than 10 percent relative to modeled expectations warrants further investigation.
When reviewing production data, look for:
- Unexplained drops in output that do not correlate with cloudy periods
- Asymmetry between similar panels if your monitoring system provides string- or panel-level data
- Gradual year-over-year declines that exceed the manufacturer's stated degradation warranty
- Clipping events in which the inverter limits output on sunny days, which may indicate the system was undersized at the inverter level
Some utility companies also provide interval-level production data through their net metering portals, which can serve as an independent cross-check against your inverter's reporting.
Inverter Health and System-Level Faults
The inverter is the central nervous system of a solar installation, and its health directly governs how effectively your panels' DC output is converted into usable AC electricity. Inverter efficiency ratings typically fall between 96 and 99 percent, but aging units, thermal stress, or component failures can push real-world efficiency below those figures.
Fault codes logged by the inverter — even those that do not trigger visible alerts — can reveal intermittent disconnections, grid communication errors, or ground faults that are silently reducing production. Reviewing the inverter's event log, rather than just its summary dashboard, is a practice that most homeowners never pursue but that can surface meaningful diagnostic information.
For systems using string inverters that are more than eight to ten years old, a professional evaluation of the unit's performance characteristics is a worthwhile investment, particularly if the manufacturer's warranty period has lapsed.
Practical Steps Toward Recovery
Addressing underperformance does not necessarily require a wholesale system overhaul. Depending on the root cause, corrective actions may include:
- Professional panel cleaning using appropriate techniques for your panel type and roof material
- Tree trimming or removal to restore clear sky exposure during peak production hours
- Retrofitting DC power optimizers onto an existing string inverter system to mitigate shading losses without full inverter replacement
- Panel-level inspection and replacement of modules showing confirmed degradation beyond warranty thresholds
- Inverter firmware updates or hardware replacement if diagnostic data points to conversion inefficiency
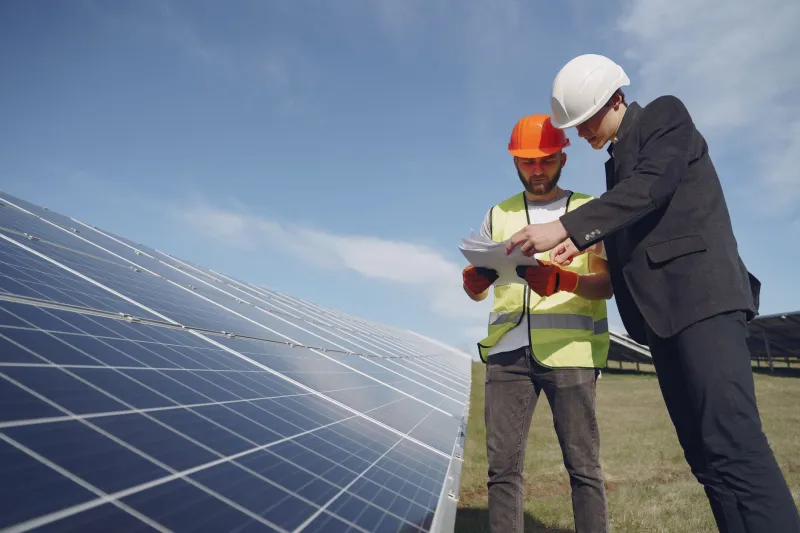
A qualified solar performance specialist — distinct from a general electrician or even a standard installation contractor — can conduct a comprehensive site audit that integrates thermal imaging, irradiance measurement, and production data analysis to isolate the specific causes of loss and rank corrective actions by cost-effectiveness.
The Value of Proactive Monitoring
Perhaps the most important takeaway is that solar performance management is an ongoing discipline, not a one-time event. Establishing a habit of reviewing your system's monthly production against seasonal benchmarks, scheduling periodic professional inspections, and maintaining clear records of output trends will allow you to identify problems early — before years of cumulative losses compound into a significant financial impact.
Your solar investment was made with a specific return in mind. Ensuring that the system consistently delivers on that promise requires the same diligence you would apply to any other major asset in your home. The energy your panels should be producing is already accounted for in your financial projections — the question is simply whether you are actually receiving it.